Create your own Covid-19 data tracker
I'm continuing to experiment with React and TypeScript. The weekend-long project this time was a Covid-19 data tracker. In this blog post I will share how I built c19stats.now.sh. I exposed the data as a public API at the same URL. I guess you, as many other people, follow the situation so you may want to glue your fingers on the keyboard and create something useful around the data. I got lots of fun playing with the diagrams.
The data
There are hundreds of Covid-19 trackers on the web right now. I first wondered where they take the data. A quick research shows a couple of major sources. And I used one of them initially. That is Johns Hopkins University. They publish some useful csv files on a GitHub repo. However, the data there is updated just once per day so I started looking for some real-time services. And I found TheVirusTracker. I ended up using their API. They have a summary per country but also a timeline statistics. Which for me was more interesting. I didn't find any information on request limits and it looks like there is none.
Edit (01.04): I got back to using JHU as a source since TheVirusTracker showed weird data for my country.
Structure
TheVirusTracker supports CORS requests so it is possible to build an app as a static page working entirely in the browser. I however followed another path. As I mentioned above I initially used Johns Hopkins University's data which is on GitHub. So I needed to pull it from there. And the most reliable way was to use GitHub's contents endpoint. All of their endpoints have a rate limit of 60 requests per hour and in order to increase that I needed to use a personal access token. Such token shouldn't be shared publicly. I had to write some back-end code.

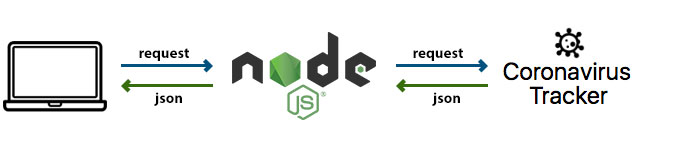
My client-side code was making request to a node process. That process fetched the data, normalized it and returned it back. I changed the data source but decided to keep this workflow for three reasons:
- I had a pretty nice layer for normalizing and caching the data. Almost always I need to transform the data so it fits my needs. I was going to have such code anyway so why not placing it on the back-end and let the client be just a consumer. The remote API is public and free and as such I shouldn't overload it with requests. To serve a high traffic I needed a cache layer. The very basic thing to solve this requirement was to implement a simple memory cache. Without a server this was not possible.
- I already spent time writing a server and didn't want to throw this work away.
- My code so far was exposing three endpoints. Why not sharing those with other developers and let other people use the normalization and caching.
A couple of hours later and my project's state was
Front-end
One of the reasons to work on this whole thing was to improve my React/TypeScript skills. I have already created some projects with those two wonderful technologies and there was a setup pattern emerging. At some point I grouped the necessary configuration into a package called beginning (you can read more about that here "Webpack/TypeScript/React starter kit as of 2020"). So, I created an empty folder and run:
npx beginning && yarn
This created a simple React app with TypeScript support.
React ecosystem
The React app itself was not something extraordinary. Because it was a small project I didn't need any state management. Everything is just an <App> component with a couple of hooks.
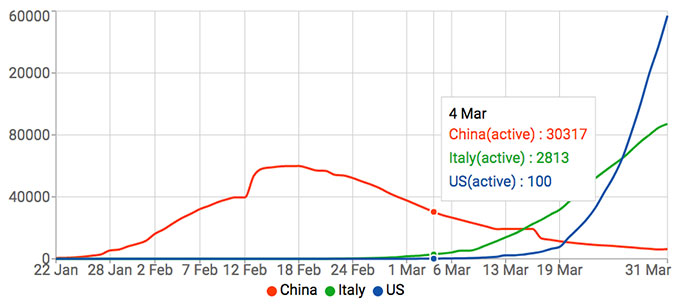
The diagrams I built with recharts. I used their <LineChart> component:
<LineChart width={900} height={400} data={graphData}>
  <XAxis dataKey="date" interval="preserveStartEnd" />
  <YAxis />
  <CartesianGrid />
  <Tooltip />
  <Legend formatter={(item, entry, idx) => data[idx as number].country} />
    <Line
      key={key}
      dot={false}
      type="monotone"
      dataKey={key}
      strokeWidth={3}
      stroke={color}
      activeDot={{ r: 5 }}
      legendType="circle"
    />
</LineChart>
The result is as follows:
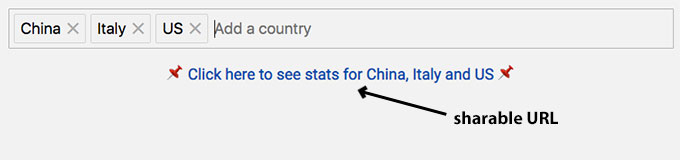
Something which I didn't like in almost every tracker is the inability to filter the data by country. Normally such apps render a wall of data and it is obviously difficult to filter the information. I wanted my tracker to have such filtering feature. I used another popular package called react-tag-autocomplete. It offers an input field for managing tags. The tags in my case were country names.
export default function Builder({ countries, data }: BuilderProps) {
  const [tags, setTags] = useState<Tag[]>(getTags(countries, data));
  const [suggestions, setSuggestions] = useState(getSuggestions(countries));

  function handleDelete(i: number) {
    const t = tags.slice(0);
    t.splice(i, 1);
    setTags(t);
  }
  function handleAddition(tag: Tag) {
    setTags([...tags, tag]);
  }

  return (
    <>
      <ReactTags
        tags={tags}
        suggestions={suggestions}
        handleDelete={handleDelete}
        handleAddition={handleAddition}
        placeholder="Add a country"
      />
      {tags.length > 0 && (
        <Link href={`https://c19stats.now.sh?countries=${tags.map(t => t.name).join(',')}`}>
          Click here to see stats for {tags.map(t => t.name)}
        </Link>
      )}
    </>
  );
}
To make the things simpler I decided to generate a link instead of immediately issuing a new request to the API. That way the user will have a sharable URL.
The rest of the app is a couple of supporting styled-components, some typings and a small data layer for requesting the back-end. All the code is published at github.com/krasimir/covid-19-stats.
Back-end
First, I want to say again that using Zeit as a platform is so delightful. Everything is happening so smoothly. In a matter of minutes I had my page on the web working driven by a node backend.
I started with the following now.json file:
{
  "version": 2,
  "builds": [
    { "src": "public/*.*", "use": "@now/static" },
    { "src": "api/*.js", "use": "@now/node" }
  ],
  "routes": [
    { "src": "/api/countries", "dest": "/api/countries.js" },
    { "src": "/api", "dest": "/api/index.js" },
    { "src": "/(.*)", "dest": "/public/$1" }
  ]
}
The public folder contains some static files like my index.html and the generated JavaScript bundle. Everything under the api directory is lambda functions. For example, behind https://c19stats.now.sh/api/countries I have
const countries = require('./countries.json');

function JSONResponse(res, data, status = 200) {
  res.setHeader('Content-Type', 'application/json');
  res.setHeader('Access-Control-Allow-Origin', '*');
  res.statusCode = status;
  res.end(JSON.stringify(data));
}

module.exports = async function(req, res) {
  JSONResponse(res, countries);
};
For accessing TheVirusTracker's remote server I used superagent. Nothing unusual there but let me paste my amazing caching logic:
const memCache = {
  lastUpdate: null,
  data: null,
};

const CACHE_TTL = 20;

function getData(noCache) {
  if (memCache.data && memCache.lastUpdate && typeof noCache === 'undefined') {
    const now = new Date();
    const diff = (now.getTime() - memCache.lastUpdate) / 1000 / 60;
    if (diff < CACHE_TTL) {
      return Promise.resolve(memCache.data);
    }
  }
  // normalization of the data
}
We first check if there is any cache at all. The data field of the memCache object holds the normalized version of the data so we can directly return it (notice the Promise.resolve call). Then if there is a cached data we measure the minutes from the last update. Here we have to clarify that whatever leaves in the global scope of the file persist. Of course if I deploy a new version of the lambda or for some reason the process gets restarted that memory cache will be flushed out. I'm however completely fine with that. The idea is to avoid constant requests to the remote side. And it works pretty well to be honest. From time to time https://c19stats.now.sh/ takes a bit more time to load but the consequence page refresh is fast.
Build your own Covid-19 tracker
Feel free to use some of the endpoints at https://c19stats.now.sh/.
- Get data for specific countries - /api?countries=US,Italy,Norway
- Get data for all countries - /api?countries=all
- Get list of all countries - /api/countries
Or you may directly go to thevirustracker.com/api and use their API. But if you want the caching you have to implement it on your own. The rest is all up to you. All the code behind https://c19stats.now.sh/ is open source and available at github.com/krasimir/covid-19-stats.
Stay home, stay safe and happy coding! 😷