Debugging with Node
Node has a wonderful debugger. As a front-end developer I’m mainly using Chrome’s tools but sometimes I run things in Node environment and this native feature comes handy. In this article we’ll see how to debug in the terminal using Node’s debugger.
When to use Node’s debugger
The native debugger is useful when we run Node programs trough the terminal and we want to see how they behave. We can run something in the console and expect what’s doing line by line. As most debuggers out there we have breakpoints, variable or expression watching, step-by-step execution.
How to run the debugger
All we have to do is adding debug to our command. Let’s get the following simple script:
// script.js

var Counter = function (text) {
  this.text = text;
  this.data = {
    words: 1,
    letters: 0
  }
};
Counter.prototype = {
  count: function () {
    for (var i=0; i < this.text.length; i++) {
      if (this.text.charAt(i) === ' ') {
        ++this.data.words;
      } else {
        ++this.data.letters;
      }
    }
    return this;
  },
  print: function () {
    console.log('Words: ' + this.data.words);
    console.log('Letters: ' + this.data.letters);
  }
};

(new Counter('Debugging in Node')).count().print();
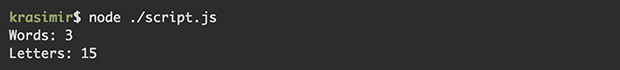
It’s a small program that counts the words in a sentence and all the characters but not spaces. If we run the program now we’ll get the following result:
Let’s assume that there is a problem with the script and we want to run it in debug mode. We have to use node debug ./script.js:
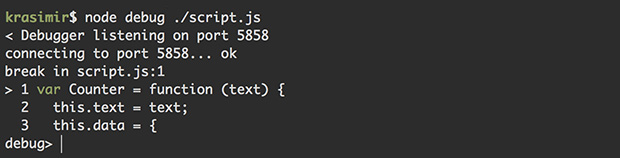
Now our program is paused at the very first line and the debugger expects our input. Notice that the debugger is listeninig on specific port. This means that we can control it remotely and that’s what (I believe) node-inspector is using.
Available commands
While we are in debug mode we have several commands available. Let’s use the example above and see the most popular ones.
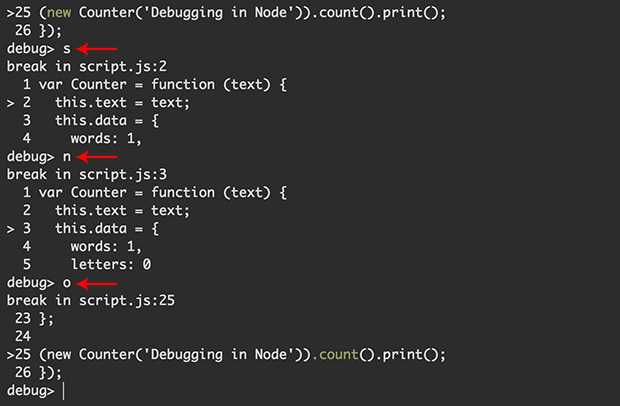
Next step (next or n)
next or n is used for moving one step forward. In our case the second step in the program is the prototype definition. After that we reach the point where we create an instance of the Counter class.
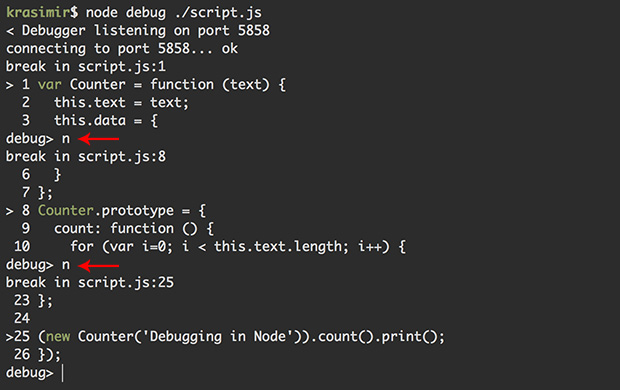
Notice the red arrows. They are showing where I typed n and pressed Enter.
Step in (step or s)
Just moving one step forward is not always enough. That’s because next step means next step but in the context of the current function. Sometimes we want to dive into another method. In such cases we use step in command.
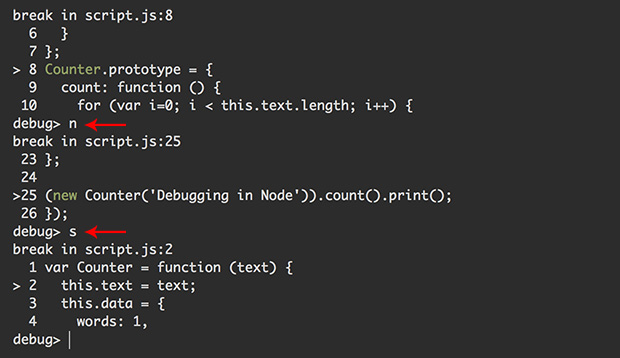
We use n till we reach the line that creates an instance of our Counter class. Sending s forces the debugger to jump inside the Counter function.
Step out (out or o)
Once we finish inspecting a function we may want to go out and continue the program’s execution. Following the example above and sending o moves the debugger to the count() call.
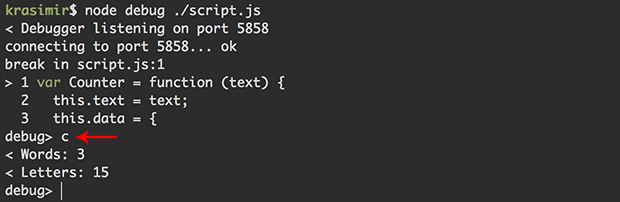
Continue execution (cont or c)
When we debug complex applications we have lots of stuff happening. Very often we have long execution path and in order to reach the interesting part we have to pass several functions. next command is not working well in such cases simply because we have to run it multiple times. It’s better to use cont or c. It tells to the debugger “Continue till you find a breakpoint”. We didn’t set any breakpoints so far so typing c as a first command executes the whole program and we see the result.
Setting a breakpoint
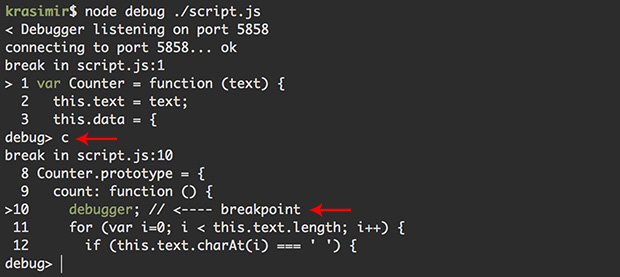
To be honest I’m not using commands to set breakpoints. This is possible by using setBreakpoint() or sb() which sets a breakpoint at the current line. Same functions accept a line number so we can break at specific line. What I’m doing is adding debugger; statement in my code. This acts as a breaking point (it works in a browser too).
Let’s say that we want to inspect the loop that reads the words in my sentence. In the very beginning of the count function we add debugger;:
count: function () {
  debugger; // <---- breakpoint
  for (var i=0; i < this.text.length; i++) {
    if (this.text.charAt(i) === ' ') {
      ++this.data.words;
    } else {
      ++this.data.letters;
    }
  }
  return this;
},
If we run the debugger it will pause at the first line of the script. Then pressing c will instruct the debugger to continue till it finds a breakpoint or the program finishes.
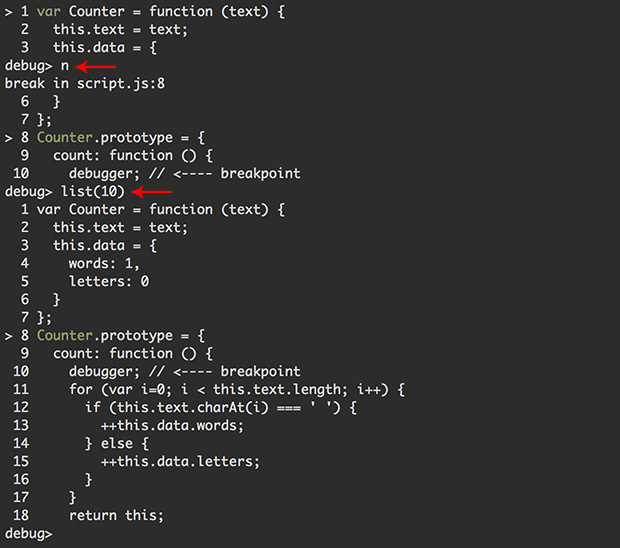
Increase visibility
You probably noticed that we see just five lines of our program at a time. Sometimes we want to see more. list command is exactly about that. It accepts a digit and that’s the number of the visible code lines. For example:
Watching
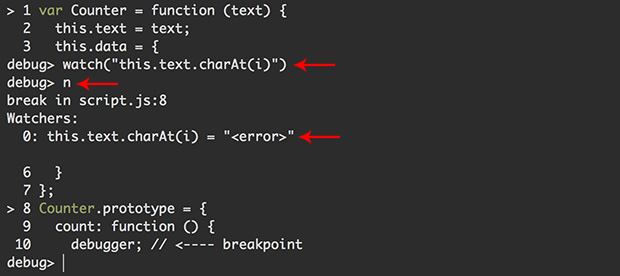
The last command that we’ll check in details is watch. It accepts an expression and it is printing it out at every debugging step. To illustrate how it works we’ll use the following expression:
watch("this.text.charAt(i)")
Of course this.text doesn’t makes sense everywhere. It is available in the count function and that’s where it returns a proper value. In the first steps we just get <error> displayed.
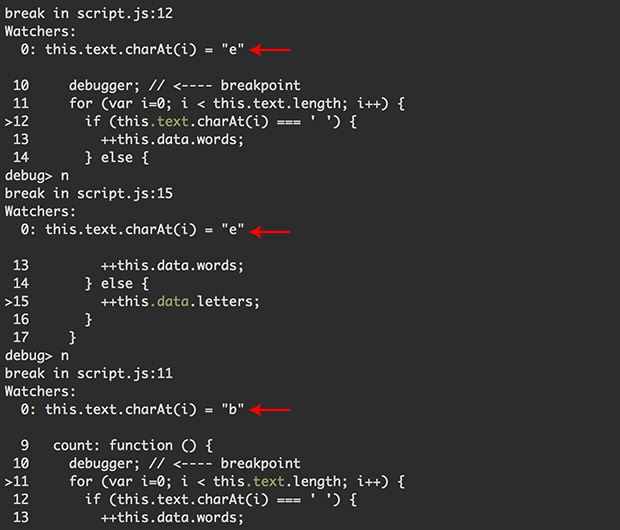
However, if we move forward and reach the for loop we’ll see the exact character read.
Other commands
There are some other commands which I personally don’t use. A full list of the available ones could be found here.
Alternatives
There are some other alternatives for debugging Node.js scripts. Most of the them involve GUI.